What causes a government debt crisis?
Typically, governments carry a certain amount of debt on their books as standard operating procedure. These are in the form of bonds. A ‘normal’ amount of between 20% – 65% is usually fine, for most countries. This actually works well, because when the fiscal situation of the government is in good order (i.e. when the government is earning enough to cover the interest on the debt + invest in infrastructure and projects that produce growth) the government is actually doing investors a huge service by providing a ‘risk-free’ asset for them to include in their diversified portfolios. The crisis comes about when the government’s debt-to-GDP ratio reaches to dangerous levels (usually 120%+) and the fundamentals of their fiscal situation becomes shaky. i.e. either GDP growth slows/stops, revenue measures are inadequate (taxpayers avoid paying their fair share by bribing officials), spending gets wildly out of control, or any combination of the three. The result of this is that the ability for the government to honor their interest payments becomes in jeopardy.
What caused Greece’s debt crisis?
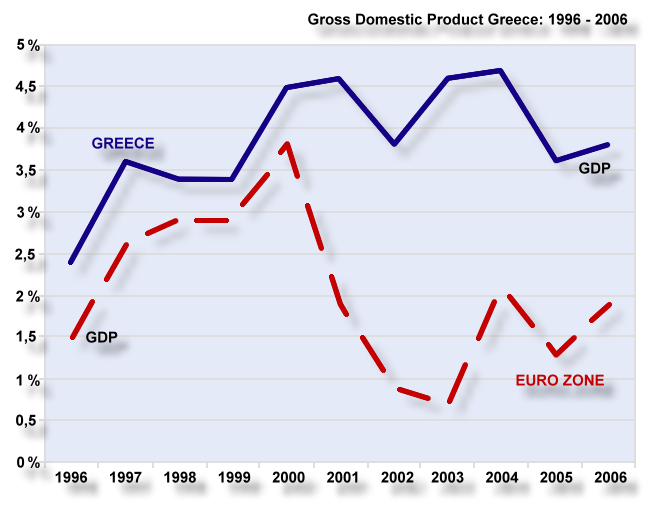
So Greece, unfortunately, has a combination of those factors. According to Greece’s Ministry of Finance (PDF), up to 2007 Greece had GDP growth rates of between 2.5% and 5% from 1996 – 2006. However, as later posts will show, it is important to note that perhaps those GDP growth figures are now to be taken with a grain of salt – as it has been revealed that previous administrations have been ‘cooking the books’. The following image shows a nice comparison of Greece and the rest of the EU during that period:
From the report, one of the things they show are the levels of government revenues (as % of GDP) and government expenditures from 2006 – 2009. This is what it says:
Gov. Expenditures: 2006 = 43.2% of GDP; 2007 = 45%; 2008 = 46.8%; 2009 = 50.4%;
Gov. Revenues: 2006 = 39.3% of GDP, 2007 = 39.7%; 2008 = 39.1%; 2009 = 36.9%;
You can generally see that the trend should be reversed. The expenses should be going down, while income goes up! The increasing expenses can be attributed to generally powerful labor unions, and free-wheeling politicians that promise more than they probably should.
Conclusion
We have seen, in Part One, that the fundamentals of the Greek economy started to falter before the economic crisis hit. In other parts we will dive deeper into what caused the sudden surge in anxiety and possible contagion effects. If you have any questions that you would like me to address, please feel free to let me know in the comments section below. I have a general guide of what I want to cover, but I am fairly flexible.
P.S. Image 1 courtesy of titanas on Flickr. Image 2 courtesy of Wikipedia.