What Can Google Hold in RAM?

For those that might not know, RAM = Random Access Memory. This is the memory that a computer uses to temporarily store data while it is in use. If you have bought a computer recently, or are familiar with the specifications on your computer, you will notice that it will be anywhere from 512MB to 4-6GB. Your hard drive capacity (which is the other GB rating on your computer) is usually much larger. Say 250GB, even up to 2,000 GB (2 Tera Bytes) in some cases. [caption id=”” align=”aligncenter” width=”430” caption=”Taken by DailyInvention (Flickr)”]
Media_httpfarm1static_qqene
[/caption]

Doing a Quick Survey

I am doing a quick survey to try and figure out the ‘Tiny Frustrations’ that people face during their 9-to-5. It is the little frustrations that make you say “there has got to be a better/easier way to do this”. Tell me about those here (Don’t worry, just 6 questions with some multiple choice =)) http://bit.ly/G10wO

NAFTA Visual Comparison-Canada vs. US vs. Mexico

Media_httpfarm3static_onhps
Mint.com frequently puts out visual graphs that take dense data and make it interesting to understand and look at. This time is no different, below are examples of an infographic that they made that compares interesting statistics between Canada, the US & Mexico.

Did You Know? Globalization and the Information Age

There is a video floating around the interwebs about the current state of our world. I can almost assure you that as you watch it for the first time, you are going to be surprised by at least a few of these statistics (if not many of them). Some of them might be glaringly obvious, but it can really cause you to take a step back when you see the actual numbers. 

[youtube]http://www.youtube.com/watch?v=jpEnFwiqdx8[/youtube]

The video was created by Karl Fisch and modified by Scott McLeod.

China vs. United States [Graphical Comparison]

It seems that graphical representations of data are all the rage these days. Mint.com has decided to throw their hat in the circle and get in the game. They have an interesting post where they compare specific figures using bar graphs.   [caption id=”” align=”aligncenter” width=”500” caption=”Welcome to China by Luo Shaoyang”]
Media_httpfarm3static_lbbor
[/caption]  

Where Do Your Federal Tax Dollars Go? [Graphic Illustration]

Wallstats.com has a nice graphic that illustrates the federal budget and how taxes are spent. It also shows, quite nicely, the gap between what the government makes and what the government spends - which has to be borrowed - otherwise known as the budget deficit (see the bottom right-side of the graphic). [caption id=”” align=”aligncenter” width=”500” caption=”What is money? by Kevin Dooley”]
Media_httpfarm2static_yuxbv
[/caption]  

Goldman Sachs Executive Compensation 18% Higher Than Q1 2008

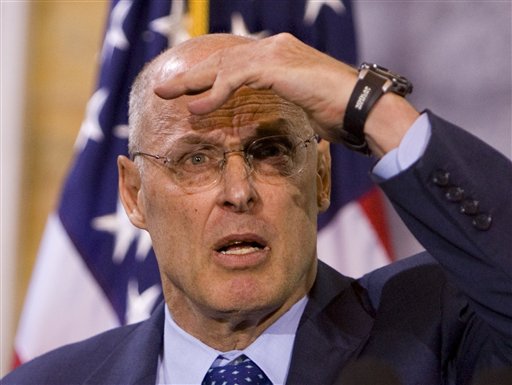
So Goldman Sachs has officially released results for Q1 - 2009.  They were significantly better than analysts’ estimates. Surprise, surprise. Most intriguing though, are the details of their earnings. When they just announced the results they caught Wall Street by surprise and there was a rally, but it seems that something changed investors’ minds. Either the $5B equity dilution they announced, or there is something else in their earnings report that investors are acting on. Let’s look more closely at their numbers. [caption id=”” align=”aligncenter” width=”512” caption=”Henry ‘Hank’ Paulson - Ex-CEO of Goldman”]
Media_httpimgwonkette_chedi
[/caption]

Why Does the Federal Reserve Intervene? [Flowchart Graphic]

According to the Dallas Fed, despite as it seems recently, The Fed doesn’t intervene lightly. There are a number of issues they take into consideration before doing so, and only do so if absolutely necessary. 

This decision tree summarizes how the Fed responds to potential financial crises. After getting a reading on the economy’s vital signs, the Fed determines whether the threat at hand might compromise the central bank’s three primary goals.

If the Fed sees little risk, no action is taken, avoiding moral hazard and leaving the markets to sort out the difficulties. The Fed reacts this way to nearly all potential troubles in the financial sector.

A pervasive threat to the overall economy or the financial system can justify direct action. The Fed rarely makes these interventions; when it does, it strives to manage the resulting moral hazard in the least costly way.

The first choice entails the Fed’s acting as an outside coordinator to bring together private institutions to defuse the threat. It’s a strategy that minimizes public-sector risk, and the central bank used it with the Long-Term Capital Management hedge fund in 1998.

When this option isn’t feasible, the Federal Reserve Act provides the authority to deal directly with pressing threats. The preferred strategy involves forging partnerships with private institutions, a course the Fed took in March 2008 with Bear Stearns, a troubled investment bank and brokerage with sufficient remaining collateral to support the intervention.

When private partners aren’t willing to step up, the Fed can act alone if troubled firms still have sufficient collateral. In September 2008, the Fed arranged a purely public intervention for AIG, a huge financial services company.

If remaining collateral is insufficient to support taxpayer-financed actions, the Fed under current law is obliged to let the markets decide a troubled firm’s fate. The Fed accepted this outcome with Lehman Brothers in 2008.

Is the Financial System Showing Signs of Recovery?

In his only 60 minutes interview, Ben Bernanke said that one way we will know that things are turning around is:
One sign would be that a large bank is successful in raising private equity. Right now, all the private money is sitting on the sidelines saying ‘we don’t know what these banks are worth’, ‘we don’t know that they are stable’ and they are not willing to put their money in the banks.